
The common misconceptions about life expectancy & why you should approach statistics with caution
- Matthieu P.J.
- Wellbeing
- June 24, 2020
In this article I will talk about humanity’s modern health journey, how modern medicine has benefited people and discuss a key metric called ’life expectancy'.
For years I had heard about life expectancy and how it is a key indicator for measuring the quality of healthcare systems and level of development of nations. It is common knowledge that we live on average longer today than 100 or 2,000 years ago. But I wondered: how does this impact me as an individual? What credence can I give to that particular statistic for gaining insight into my own life longevity?
Table of Contents
The major improvement of life expectancy in modern history
Throughout the 20th century, mankind has reached an unprecedented level of technological, societal and economic development. Healthcare has benefited in an astonishing manner. A key indicator of this progress is the life expectancy, a number we sometimes hear about. See for yourself on this chart showing the life expectancy of the UK population over the last 500 years or so.
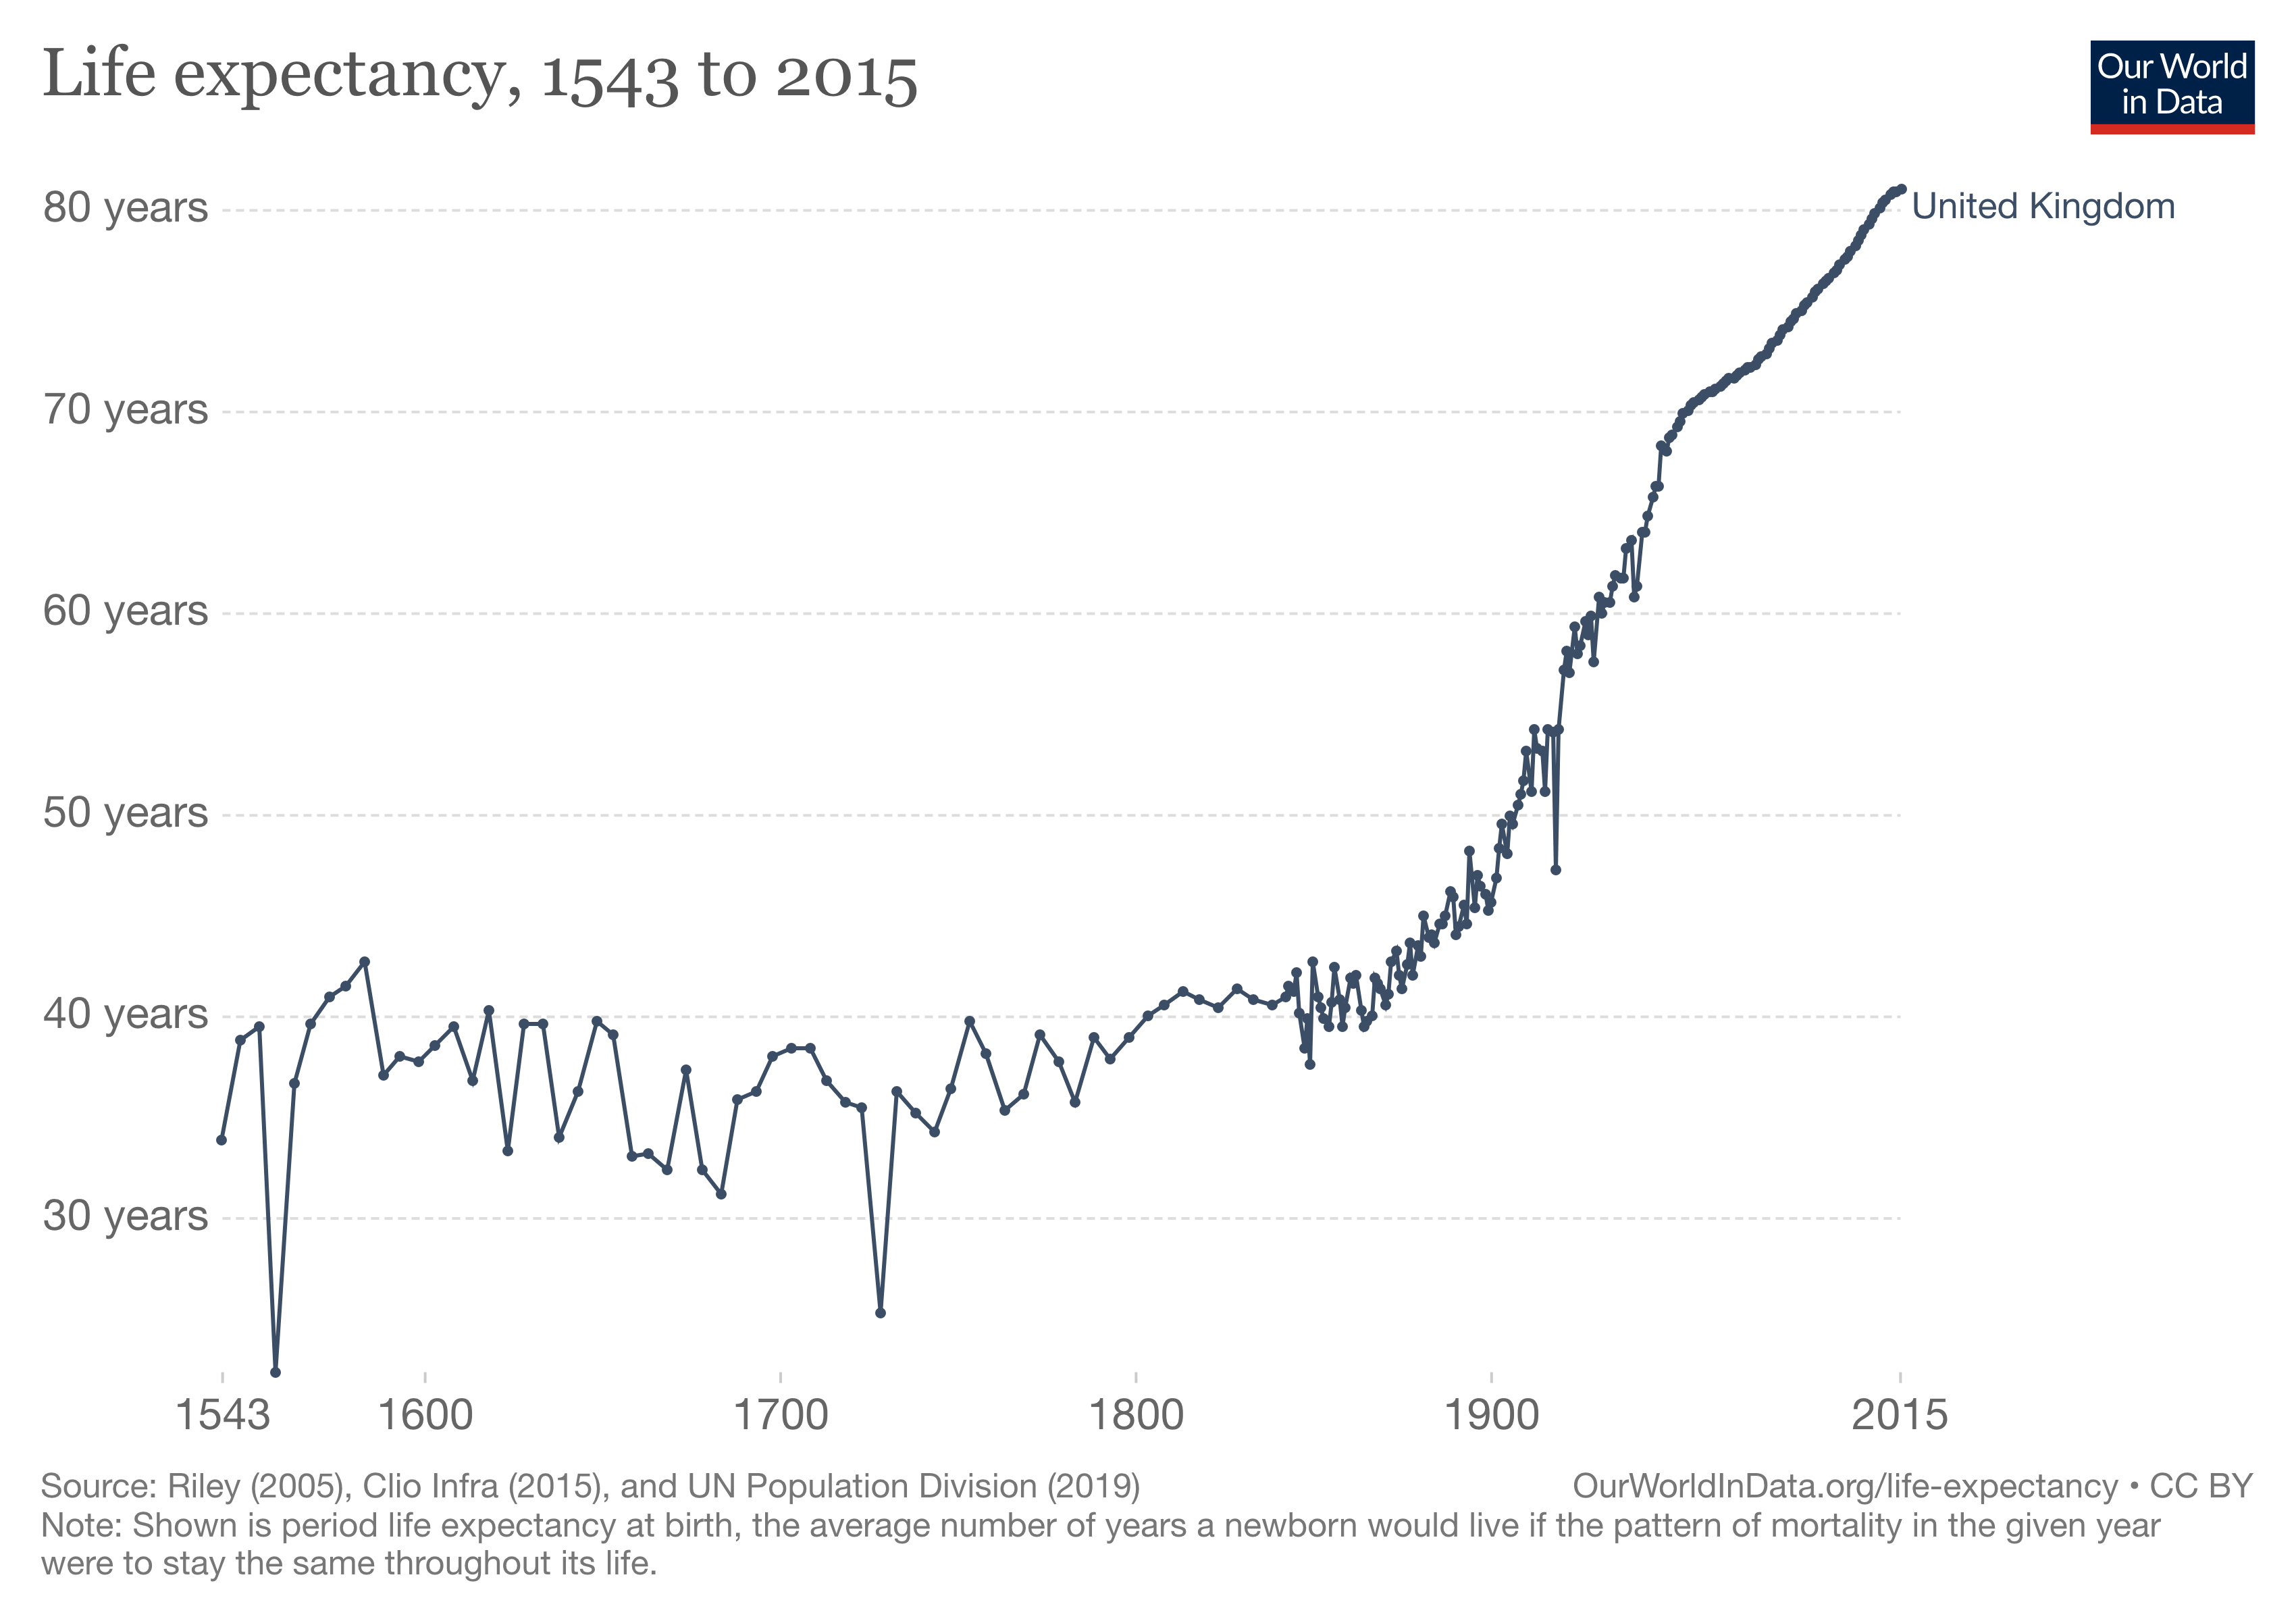 Source: https://ourworldindata.org/life-expectancy
Over the generations, life expectancy has increased due to factors such as: improved working conditions, reduced smoking rates, improved healthcare, reduction of infant mortality rates and deaths from infectious diseases. In the early 1900s, a person based in the UK lived on average less than 50 years. By contrast in 2020 the life expectancy of British people is over 80 years! That’s a 60% bonus time when you think about it. Fantastic isn’t it?! Yes… but there is more to say.
DEFINITION OF LIFE EXPECTANCY:
Life expectancy is a statistical measure of the average time someone is expected to live based on the year of its birth, its current age, and other demographic factors including gender. The most commonly used measure is life expectancy at birth (LEB). […]
Mathematically, life expectancy is the mean number of years of life remaining at a given age, assuming age-specific mortality rates remain at their most recently measured levels.
—Wikipedia
For one thing, after rising continuously for decades, there is now a slowdown in life expectancy improvements. In fact several projections had to be revised in 2019 against some announcements made in 2016. In short, child life expectancy projections were cut by several years. So this is official, after decades of continuous improvement, life expectancy is now stagnating. It seems we have somehow reached the pinnacle of what our modern medicine can offer.
Secondly, yes we now live longer, but it does not necessarily mean we live a long and healthy life. In fact, we now reached a point where the proportion of our life that we spend in ‘good health’ tends to diminish. It’s a subtle decrease yet it’s happening. Look at this chart.
 Source: www.ons.gov.uk
So next to the life expectancy there is another statistic which I feel matters a lot too: the ‘healthy life expectancy’.
The healthy life expectancy (HLE) is the average number of years that an individual is expected to live in a state of self-assessed good or very good health, based on current mortality rates and prevalence of good or very good health.
You may live longer in the absolute, but if you spend the last 15 to 20 years of your life with heavy medical assistance, are you living a happy life? Are you really living at all? You may know people around you who are ‘kept alive’ with an endless series of pills and treatments. I certainly have witnessed that situation and this can be heart-breaking. It seems this is more to the benefit of those surrounding the elderly than the patients themselves. It seems that men are obsessed with living as long as possible—no matter in what conditions they live. The age-old dream of immortality for men worried about plunging into the abyss of death and non-existence… By the way some people are convinced that the advance of bio-technologies will offer them virtual immortality. How far are we willing to go in order to stay alive?
Calculating your life expectancy
Now moving beyond the general statistics, let’s see what this means for you. There is a well-designed ’life expectancy calculator’ provided by the ONS (British Office for National Statistics). Here it is below.
Type in your age, choose your gender (females live longer than males) then click on the ‘Calculate your life expectancy’ button.
Note—You can also scroll down as there’s more than just a number. But I suggest you do not scroll down yet because I will get back to this later in the article.
Sounds exciting, I now know how long I will live for… what a relief! Laughter. So what’s wrong with that approach? Well, one key thing has been overlooked.
THE FIRST MISCONCEPTION
Some people got so accustomed to this famous life expectancy that somehow they may think that whatever they do, they are guaranteed to reach the age of their life expectancy—which is all very much based on the year and country of birth. But that is simply NOT true. Because from a statistical point of view, life expectancy is an average value which means that as an individual its relevance is limited. Indeed, fluctuations are large from one person to the other on both side of an average value.
When you read your life expectancy as computed by the ONS it does not ask you anything that really matters to give you a more accurate prediction of how long you could live. Such questions that would make it much more relevant are: your overall health since birth and at this point in time; your weight and height; how much you exercise; if you smoke or drink alcohol regularly; your access to healthcare; your social class; your health education etc.
Beware of statistics. They are good for governments and corporations to make calculations & projections (for example: governments for pension payments; or insurance companies for their policies). But they are general and do rarely apply to your personal circumstances.You are so much more than just a statistic!
A different way to look at life expectancy
Back to the start: life expectancy is a statistical vision of how long a person will live on average. But behind this straightforward number lies a much more complex reality. Here’s another less known—yet more accurate—face of life expectancy.
SURVIVAL CURVES
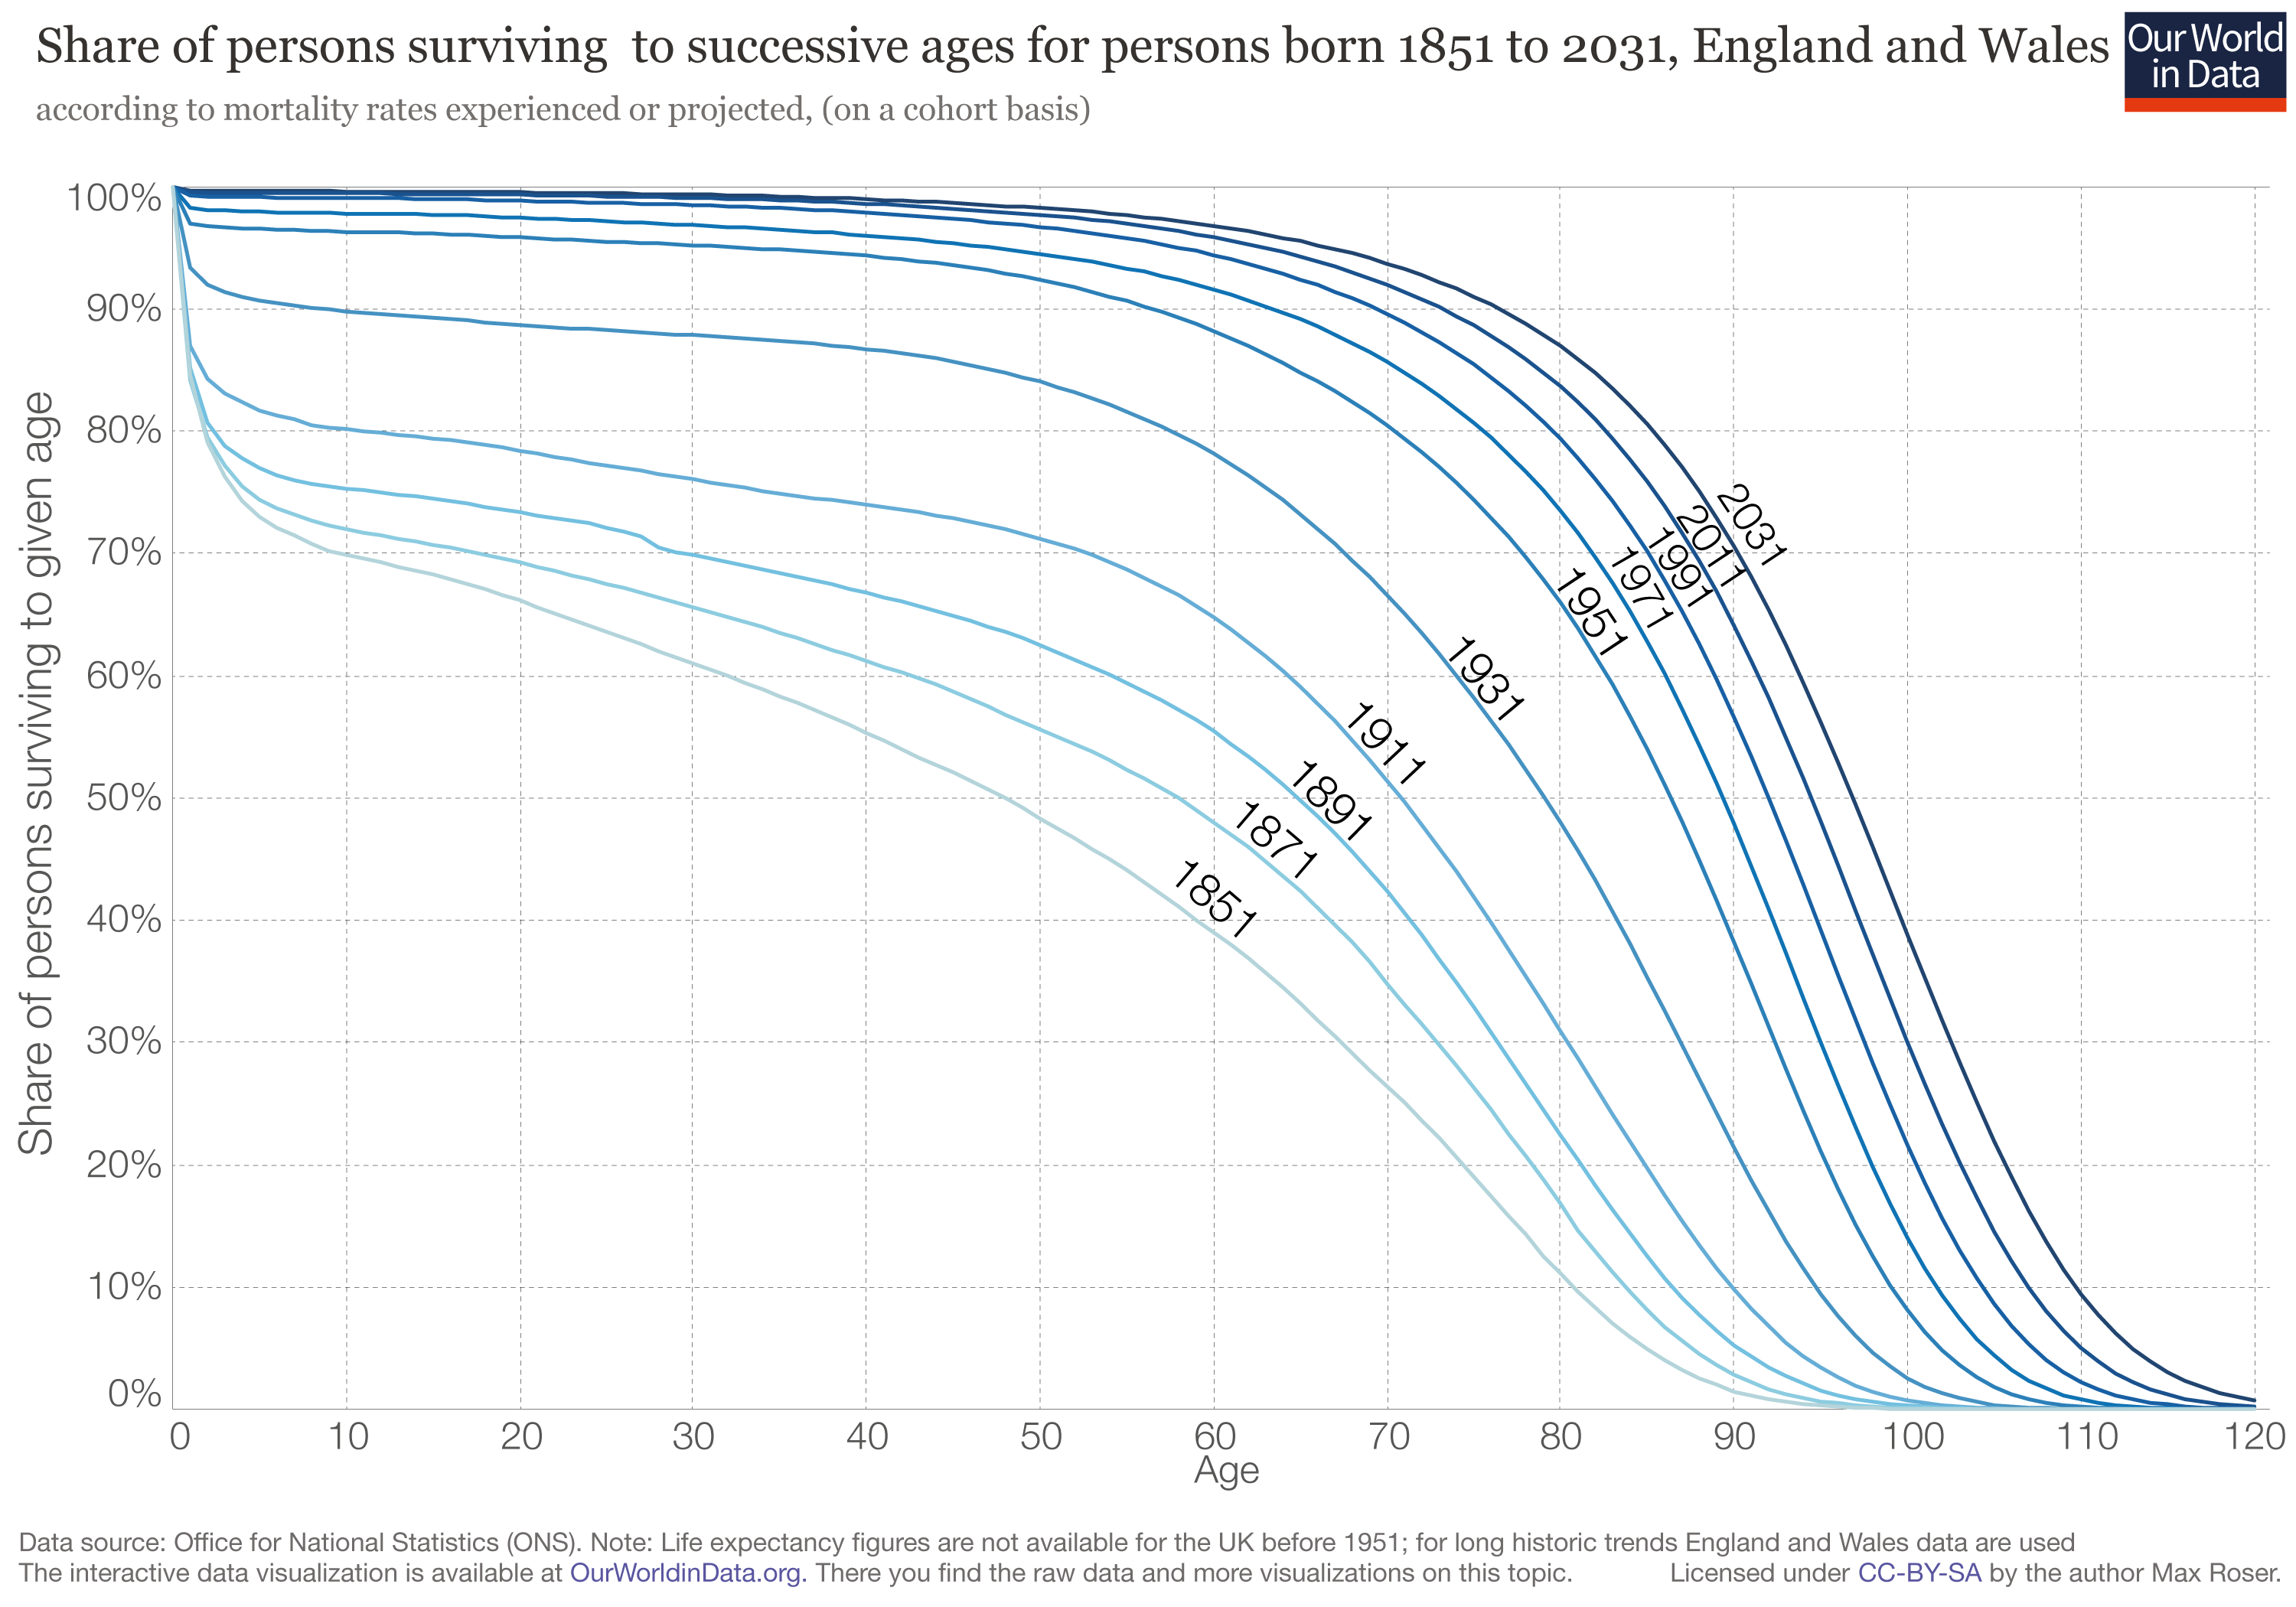 Source: https://ourworldindata.org/life-expectancy
This chart shows the proportion of persons that survive to a given age in the overall population. I think it’s a much better way to look at life expectancy. Each curve is plotted for people born a certain year: 1851, 1871 etc. These curves that go down represent the amount of people born in a certain year that are still alive as they reach the age marked on the X-axis. They start at 100% at age 0 (so all curves start at the same point) and then go down till they finally reach 0% at a given age (which is the maximum lifespan).
It helps appreciating the full dynamic of life expectancy. Indeed those curves tell a much longer story than a single number can. What they tell you for example is:
- ~10% of people born in 1851 reached the age of 80 despite the overall medicine standards being lower than today.
- ~30% of kids born in 1851 did not live beyond age 10.
- ~20% of people born in 1951 will not live beyond age 70.
- We expect ~10% of people to be born in 2031 to live till age 110.
- Regardless of the year people were born (since 1851), there has always been people living till 90 and above. It is just that their proportion compared to the rest of the population is different (higher proportion in recent years).
The progress of medicine in the last 170 years can really be appreciated here. All the curves eventually reach 0% but what is relevant is their shape: for example how steady the drop in the first part of the curve is (relating to infant mortality). But these curves do not tell you anything about the underlying health condition of people who die. You just know how many they are as a percentage of the group of people who were born the same year. So the secret of healthy life is definitely not on those charts…
But this is where it really gets interesting. You may wonder: how can we reconcile this last chart and life expectancy given as a plain number? How is it possible that for people born in 1971 (therefore with a life expectancy of ~ 72 years) the chart shows ~50% of them are expected to reach the age of 90?
The true meaning of life expectancy
THE SECOND MISCONCEPTION
Now we’re going one step further into the rabbit hole… and unearth another misconception about life expectancy that may shock you. It’s good to get back to definitions. What exactly are we looking at when we talk about life expectancy? I gave you a hint in the second paragraph of the definition given at the beginning of this article. Now it’s time to get into the details. The ‘plain number’ we usually hear about is actually life expectancy at birth (or LEB). But past that point, life expectancy will change across your whole life!
♣ Now you can get back to the ONS calculator I gave earlier. Input the information again but after you click on the button, scroll down to see the chart it also gives you.
Let’s take an example together. Let’s say you are a male born in 1980 therefore your life expectancy at birth would be ~71 years. But if you use the calculator you would read the following:
- your current life expectancy (as of 2020) is 85 years
- there is 25% chance you will live till age 90
- there is 10% chance you will live till age 98
The calculator will also give you the following chart tailored to your particular situation (again just knowing your gender and current age which is very little):
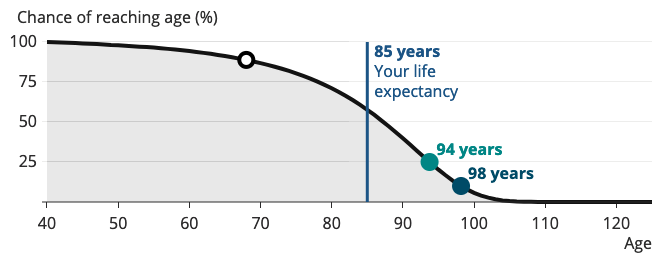
Now this looks similar to the curves we have seen above. Still confused? What you need to remember is that these are statistics: a forecast based on the data available for other people from the same cohort (i.e. group with similar characteristics and here that means the same age). So the survival curves above were showing you a lot more details than the standard LEB. Also bear in mind that unless we are looking at ancient data where all people are dead (and therefore we are sure of the age of their death), for the recent past where many people are still alive these are just projections. The chart subtitle was “according to mortality rates experienced or projected”. And this is also important to understand: statistics often use assumptions and one here is that the future mortality rates will be quite similar to the present ones.
At this point you may wonder: how is life expectancy even calculated then? Look at this:
SURVIVAL TREE
 Source: Wikipedia
That survival tree explains the calculation of life expectancy. Red numbers indicate chance of survival at a specific age, and blue ones indicate age-specific death rates. Basically at an individual level, at each birthday you have statistically x% of chance to reach the next birthday etc. The traditional LEB is an aggregation of all these potentialities across an entire lifetime for an entire population; it flattens it all into a single number using some mathematical models & assumptions. And remember, LEB is only meaningful when you are born. Thereafter, your life expectancy will change every year! It’s a variable value and not a static one as many people could assume.
See this last chart to appreciate what it means:
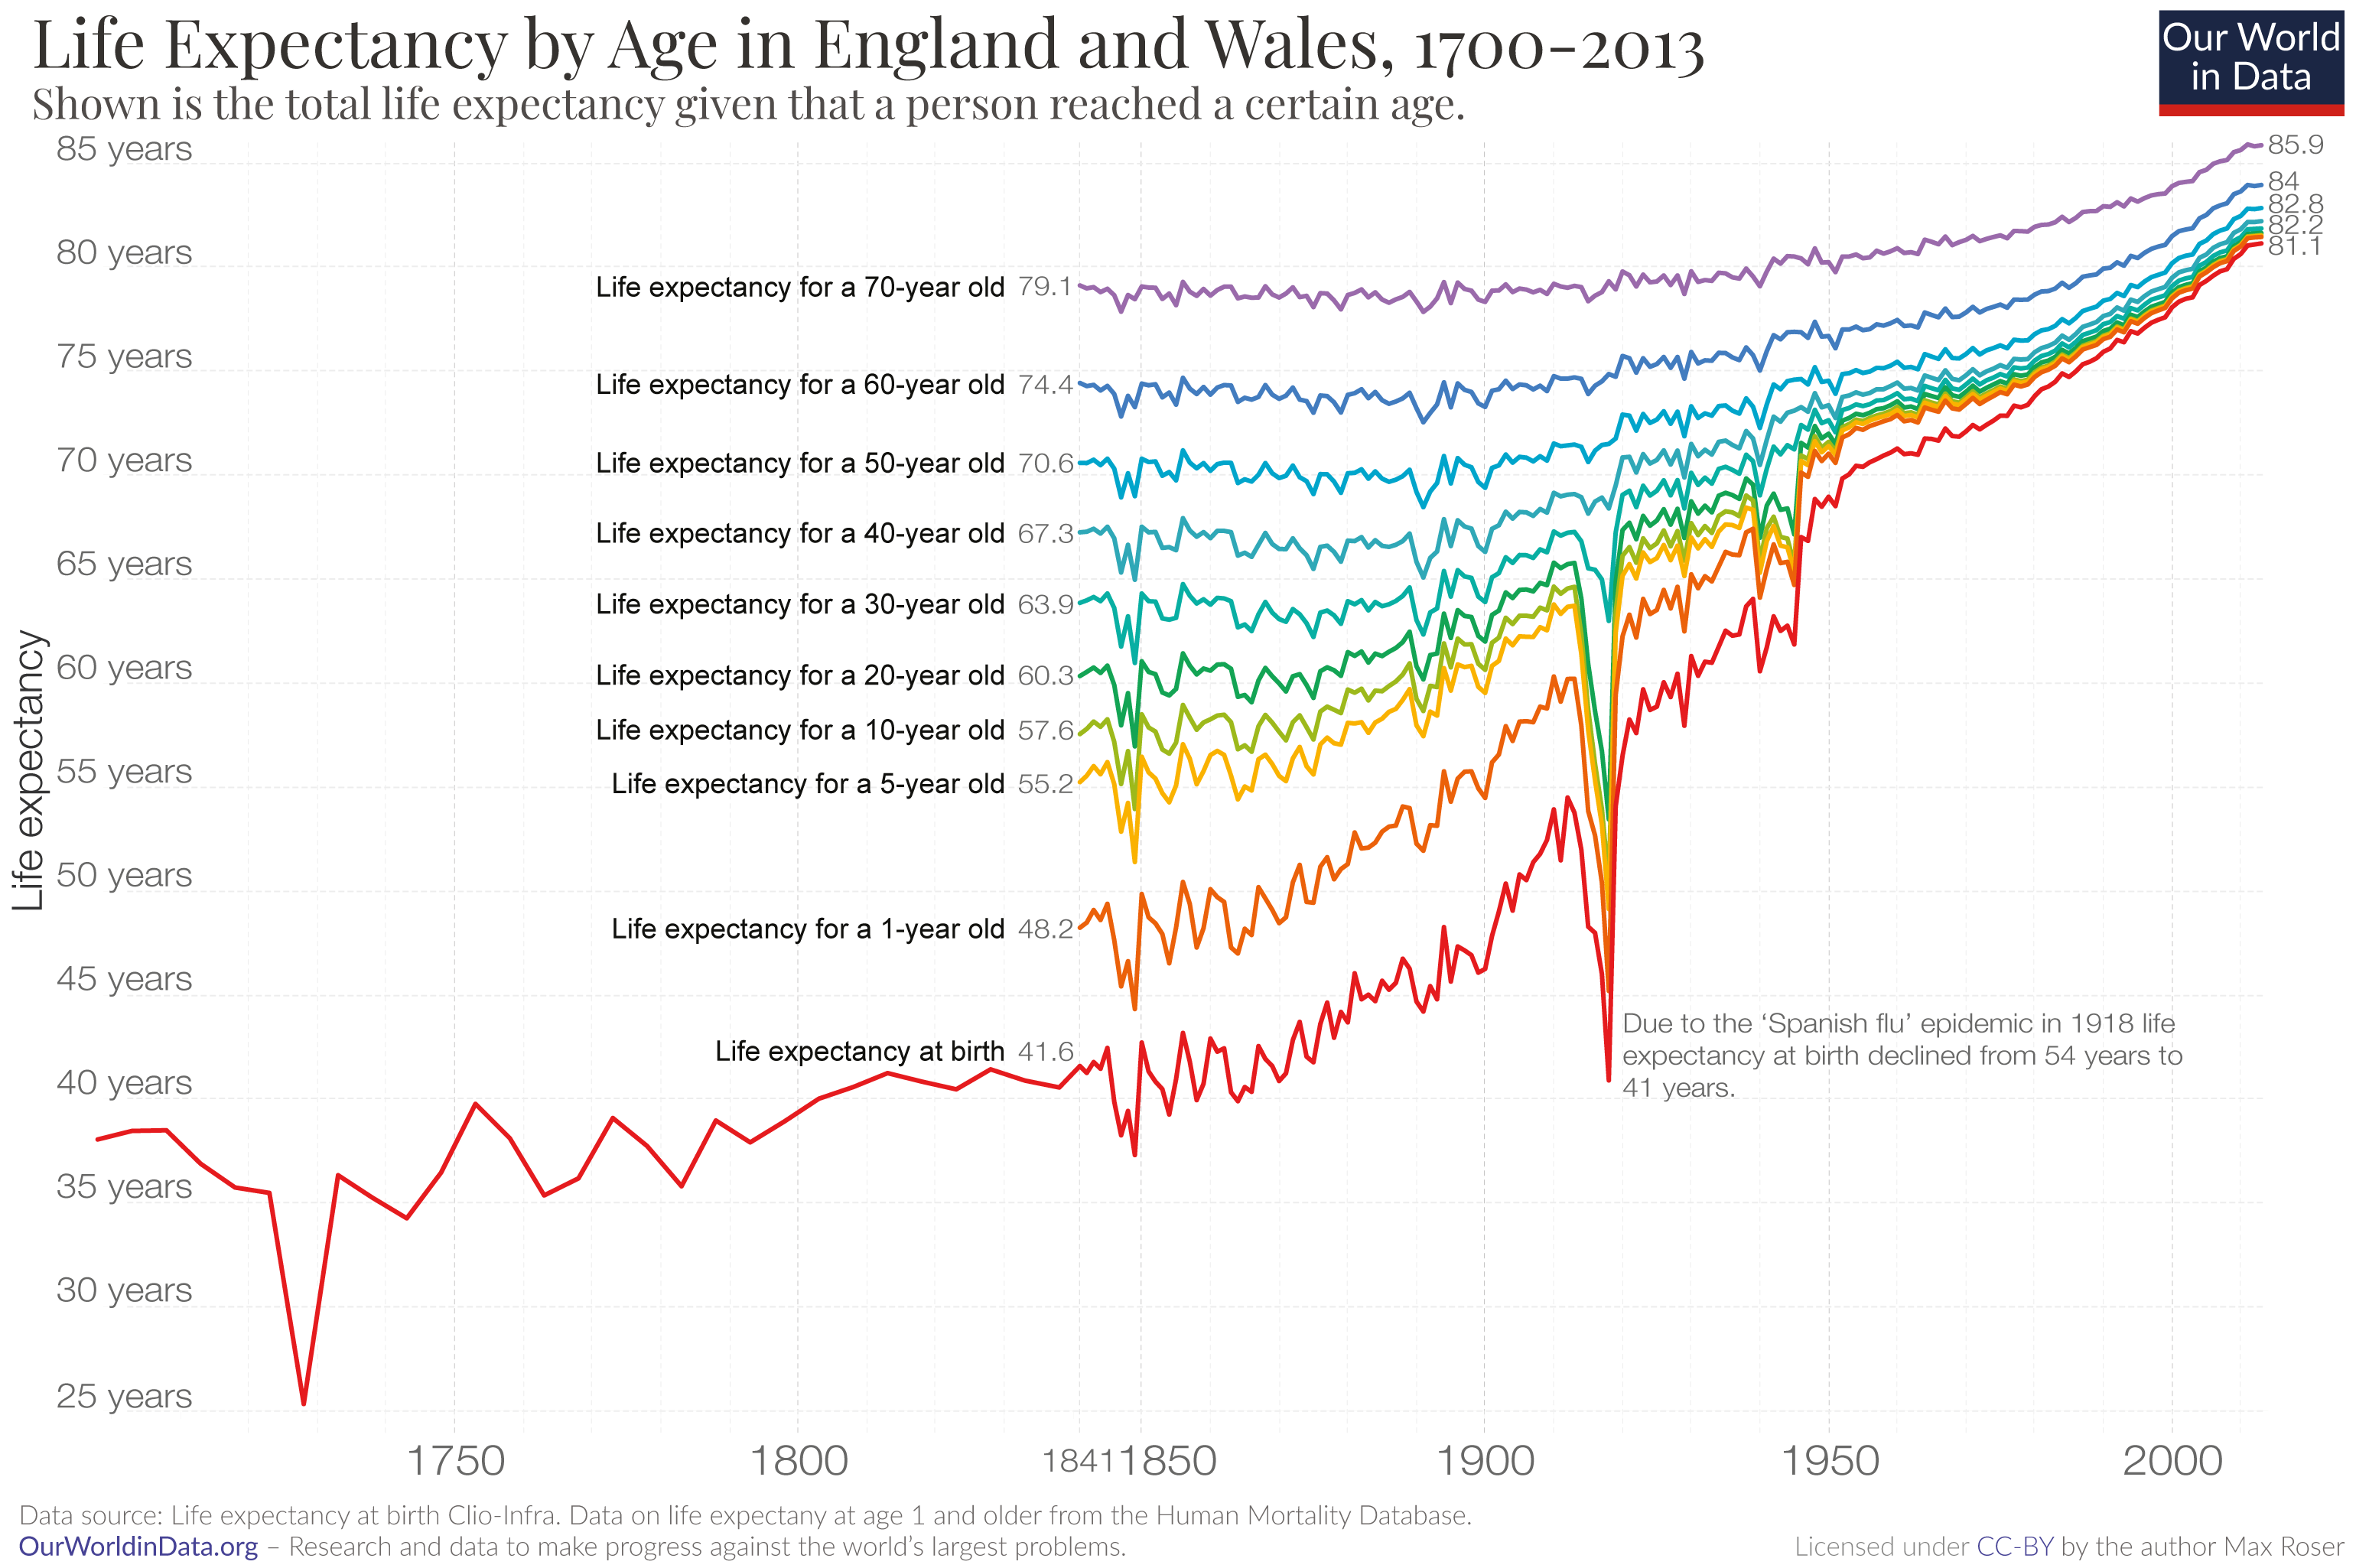 Source: https://ourworldindata.org/life-expectancy
Now that you know that life expectancy depends on age too, it should start making sense. All these coloured curves show you the life expectancy at different ages. Note that the curves are pretty close to each other on the right side i.e. the more recent past; but in the distant past not quite so!
Final thoughts
As a closing note, I’ve gathered these important considerations from Wikipedia to give you even more context:
Life expectancy is commonly confused with the average age an adult could expect to live. This confusion may create the expectation that an adult would be unlikely to exceed an average life expectancy, even though, with all statistical probability, an adult, who has already avoided many statistical causes of adolescent mortality, should be expected to outlive the average life expectancy calculated from birth. One must compare life expectancy of the period after childhood, to estimate the life expectancy of an adult. Life expectancy can change dramatically after childhood, even in preindustrial times as is demonstrated by the Roman Life Expectancy table, which estimates life expectancy to be 25 years at birth, but 53 years upon reaching age 25. […]
Life expectancy is an average for all people in the population—including those who die shortly after birth, those who die in early adulthood (e.g. childbirth, war), and those who live unimpeded until old age.
Life expectancy [also] differs from maximum life span. Has the human race [really] increased its life span? […] There are many examples of people living significantly longer than the average life expectancy of their time period, such as Socrates, Saint Anthony, Michelangelo, and Benjamin Franklin.
—Wikipedia
I hope this intellectual exercise has broadened your perspectives—on top of possibly giving you a mild headache. Life expectancy is just an average value that cannot tell you much after all. It may seem the answer to a natural question: “How long am I likely to live?”. But as it turns out, it is such an over-simplified statistic that you should not use it in that way. Even worse, life expectancy is variable and depends on your age so it will vary throughout your entire lifetime.
This reminds us that statistics are just a tool. And like any tool, you need to know how to use them properly. Statistics can even be misleading without their full context. Because they illustrate group trends, the facts at an individual level are often quite different! Your personal circumstances and your health are unique. You are not a statistic. And taking any statistic for personal prediction would be unwise.
Nowadays I’ve observed that too often we ‘flatten’ some notions because we want to take away something meaningful yet simple to understand. We love one-size-fits-all metrics. I think this is one of the dramas of our time: we simplify things to such a point that sometimes they lose their meaning. The reality is always rich in details & nuances.
BIBLIOGRAPHY
Life expectancy
https://en.wikipedia.org/wiki/Life_expectancy
https://www.gov.uk/government/publications/health-profile-for-england/chapter-1-life-expectancy-and-healthy-life-expectancy
https://www.ons.gov.uk/peoplepopulationandcommunity/healthandsocialcare/healthandlifeexpectancies
https://www.indexmundi.com/facts/united-kingdom/life-expectancy-at-birth
Health state life expectancies, UK: 2015 to 2017
https://www.ons.gov.uk/peoplepopulationandcommunity/healthandsocialcare/healthandlifeexpectancies/bulletins/healthstatelifeexpectanciesuk/2015to2017#healthy-life-expectancy-fails-to-keep-pace-with-life-expectancy-for-males-and-females
Life expectancy calculator
https://www.ons.gov.uk/peoplepopulationandcommunity/healthandsocialcare/healthandlifeexpectancieslifeexpectancycalculator/2019-06-07
Child life expectancy projections cut by years
https://www.bbc.co.uk/news/health-50631220